AI Productivity vs Usage: Prove Real Output - Provn
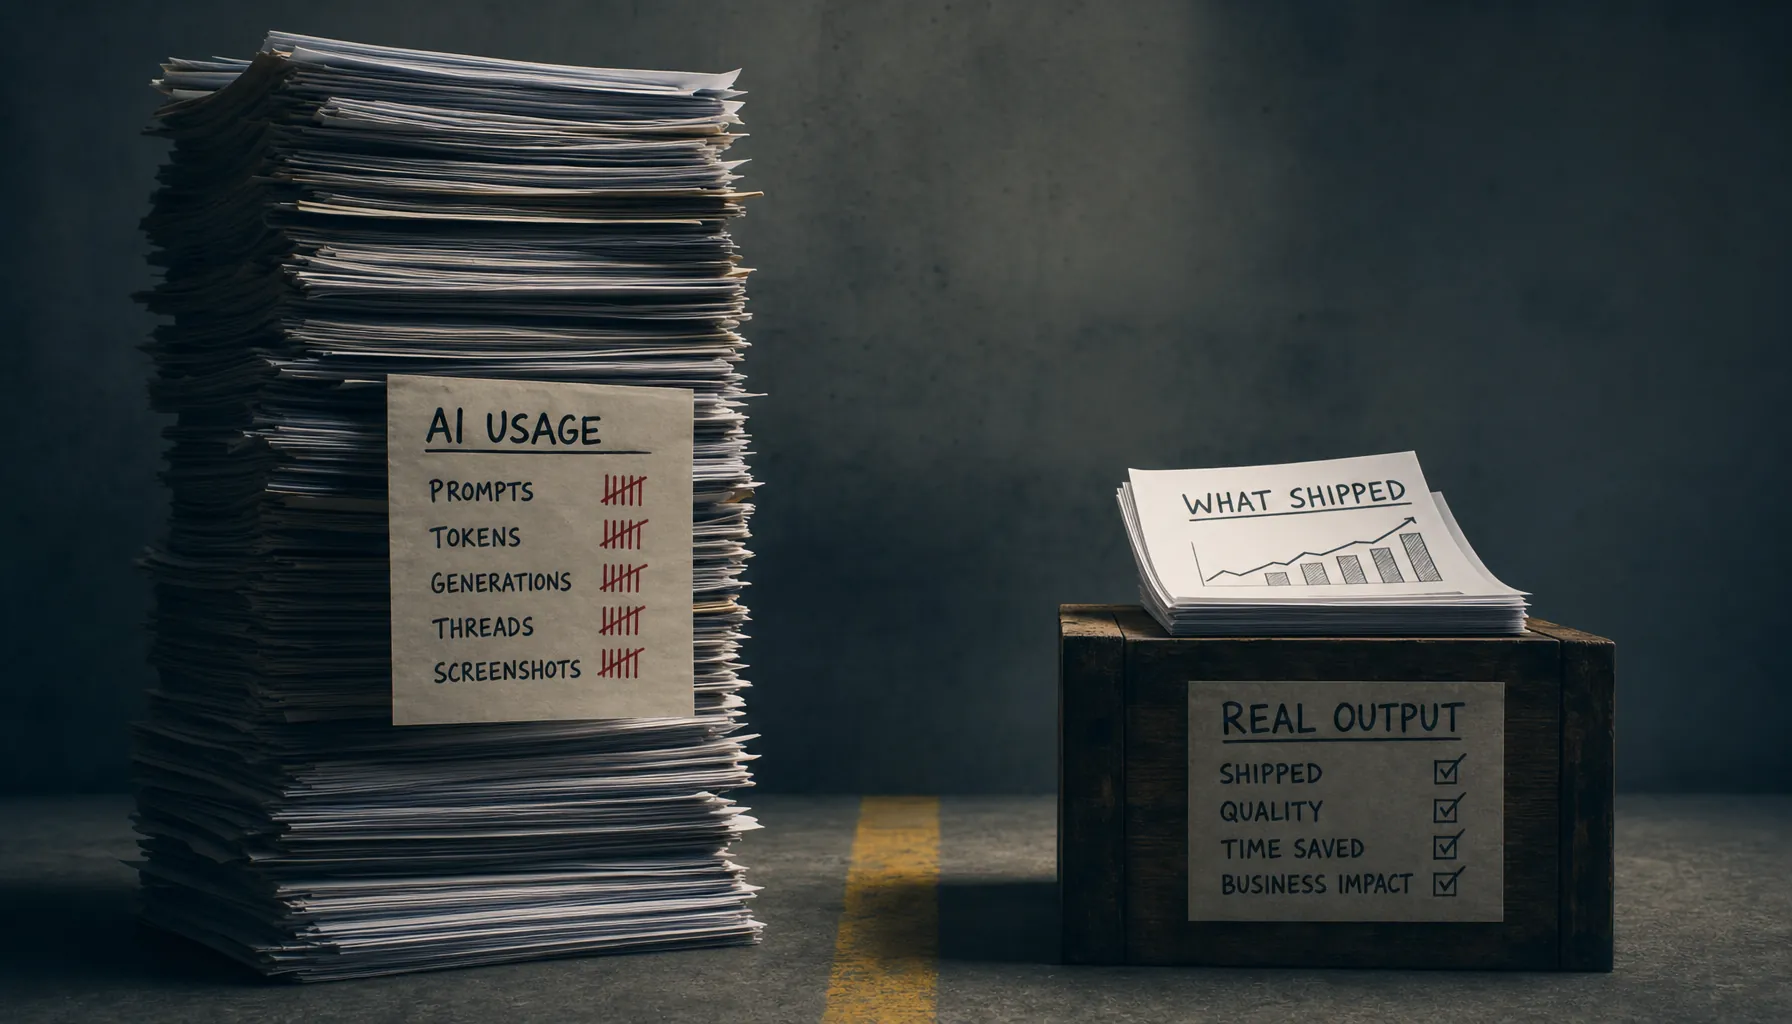
Using AI a lot doesn’t automatically mean you’re productive. What counts is what actually shipped, the quality of the work, time saved, and business results — not token counts or screenshots of tools.
GitHub’s controlled Copilot study found developers completed a coding task 55.8% faster with AI help, but the study measured finished work, not prompts, tokens, or hours spent inside a chatbot.
That distinction is the whole point of AI productivity vs usage. Usage tells you someone used AI. Productivity tells you whether the work got faster, better, cheaper, or more useful once AI entered the workflow.
Key Takeaways
- AI usage is an input metric. Prompt count, token volume, tool logins, and model calls show activity, not productivity.
- AI productivity needs output evidence. Track shipped work, cycle time, defect rate, review burden, and business impact.
- Token volume can move in the opposite direction of productivity. A builder who burns 400,000 tokens to avoid one hour of thinking may be slower than one who uses 20,000 tokens to ship a tested feature.
- Hiring managers should ask for before-and-after proof. Good AI work samples show the problem, workflow, decisions, final artifact, and measurable result.
- Quality gates matter more as AI use rises. AI-generated output needs review standards, test coverage, source checks, and clear ownership.
AI Productivity vs Usage: The Core Distinction
AI productivity vs usage comes down to this: are you measuring tool activity, or are you measuring work that changed an outcome? Usage counts prompts, tokens, sessions, or hours with AI. Productivity counts shipped output, time saved, quality maintained, and business impact.
The job market has already learned this the hard way. Candidates show off elaborate tool stacks, agent screenshots, prompt libraries, and chat histories. That proves exposure. It does not prove judgment.
A builder who uses AI well leaves a different trail. There is a before state. There is a constraint. There is a workflow. There are dead ends they abandoned. There is a shipped artifact. There is a measurable result. That is the evidence hiring teams can actually evaluate.
This is why Provn’s hiring thesis is simple: performance over pedigree, proof over polish. AI did not make proof less necessary. It just made polished-looking nonsense much easier to produce.
According to Stanford University’s 2025 AI Index Report, reported organizational AI use rose sharply in 2024, with 78% of organizations reporting AI use compared with 55% the year before. That explains the noise. It does not tell you who is actually doing better work.
The useful question is narrower: after AI enters the workflow, what gets shipped that otherwise would not have shipped, or what gets shipped with less time, lower cost, fewer errors, or higher value?
Why Token Volume Is a Weak Productivity Signal
Token volume is a cost and capacity signal, not a productivity signal. High token usage can mean useful exploration. It can also mean sloppy scoping, repeated retries, weak prompts, runaway agent loops, or rework caused by low-quality output.
Tokens are easy to count because systems log them automatically. That makes them tempting. The same thing happened with keystrokes, call counts, and meeting hours. If a metric is easy to grab, somebody will eventually pretend it matters more than it does.
Usually, it doesn’t.
A 90-minute AI session may produce a production-ready migration plan. It may also produce twelve conflicting drafts and no decision. Both look active in a usage dashboard.
The same problem shows up in token budgets. A team can spend more on model calls because it is automating useful work at scale. It can also spend more because poorly controlled agents are looping, pulling irrelevant context, or rewriting the same file over and over. The cost side belongs in the broader AI cost vs employees discussion, but the productivity side starts here: usage is not evidence of value.
Token volume becomes useful only when you pair it with output. For example, “120,000 tokens used” means almost nothing. “120,000 tokens used to reduce weekly data QA from six analyst hours to 45 minutes, with sampled error rates unchanged” means something.
The same principle applies to agent workflows. If autonomous systems are involved, token counts can grow fast because agents plan, call tools, reflect, retry, and verify. The operational cost details are covered in Agentic AI Costs (2026): Token Usage and Workflow Controls. For productivity measurement, the real question is whether those loops reduce human work or just create a fresh review queue for humans to clean up.
The Five-Metric Scorecard for Real AI Productivity
Real AI productivity should be measured across five categories: usage, time, shipped output, quality, and business impact. A credible claim needs at least three of the five, and one of them must be shipped output or business impact.
The mistake is treating one metric as the answer. Time saved without quality can create cleanup work. Output shipped without business impact can be busywork. Business impact without workflow evidence can be luck, timing, or attribution theater.
The better approach is a scorecard.
| Metric | What it measures | Weak version | Strong version |
|---|---|---|---|
| Usage | AI activity and resource consumption | “I use Claude and ChatGPT daily.” | “I used AI for requirements synthesis, test generation, and code review on a shipped billing flow.” |
| Time | Cycle time, hands-on time, waiting time | “AI made me faster.” | “The reporting workflow fell from 4.5 hours to 70 minutes across six weekly runs.” |
| Shipped output | Completed artifacts delivered to users or teams | “I built prototypes with AI.” | “I shipped a support triage tool used by 11 agents for 3,200 tickets in its first month.” |
| Quality | Error rate, defect rate, review load, maintainability | “The output looked good.” | “Escalation errors stayed below 2% in a 200-ticket audit after launch.” |
| Business impact | Revenue, cost, retention, risk reduction, throughput | “It helped the team.” | “The tool reduced manual triage by 18 hours per week and cut first-response time by 22%.” |
This scorecard follows the same logic as mature software delivery measurement. The DORA Four Keys metrics focus on deployment frequency, lead time for changes, change failure rate, and failed deployment recovery time because activity alone does not describe delivery performance. Shipping more commits is not the same as improving software delivery.
The same is true for AI work. The number of prompts is not the unit of value. The unit of value is an improved workflow, a working product, a better decision, or a bottleneck removed.
Usage Metrics Are Still Worth Tracking
Usage metrics are useful for cost control, adoption tracking, and workflow diagnosis. They become misleading only when people treat them as a stand-in for skill or productivity.
Track prompts, tokens, model calls, tool runs, and agent retries. Just label them correctly. They answer “how much AI activity occurred?” They do not answer “was the work better?”
A good usage dashboard can still reveal operational problems. If token volume doubles while shipped output stays flat, the workflow may be bloated. If usage piles up in planning but not production, AI may be helping ideation without changing delivery. If agents run overnight but humans spend the next morning fixing hallucinated assumptions, the system is shifting labor rather than reducing it.
Usage is the smoke detector. It is not the fire report.
Time Saved Must Include Review and Rework
Time saved is valid only when it includes review, correction, integration, and rework. Measuring the first draft alone inflates AI productivity because the first draft is often the cheapest part of the work.
This is where a lot of claims fall apart. A builder says AI wrote the first version in 20 minutes. Then another engineer spends two hours fixing edge cases, security assumptions, and dependency conflicts. Once you count the whole system cost, the productivity gain disappears.
The controlled GitHub Copilot experiment is useful because it measured task completion time, not just generation speed. According to GitHub’s research on Copilot’s impact on developer productivity, developers using Copilot completed the assigned task 55.8% faster than the control group. That is a productivity claim because the unit was completed work.
The lesson is not that every AI workflow gets that result. The lesson is measurement design. Measure the finished task. Include review. Include defects. Include the person who had to clean up the output, because there is usually one.
How to Measure AI Productivity in a Builder Portfolio
A builder portfolio should show the work system before AI, the intervention made with AI, and the measurable result after shipping. The strongest portfolios make the evaluator believe the builder could repeat the method under real constraints.
Most AI portfolios are too theatrical. They show the interface. They show the prompt. They show the polished final output. They skip the operational evidence: what failed, what was tested, what was reviewed, and what changed because the work actually shipped.
For hiring, that is the difference between tool familiarity and builder signal. Provn’s related piece on AI productivity metrics for builders goes deeper into output signals. The practical portfolio structure is straightforward.
Step-by-Step AI Productivity Measurement
A repeatable AI productivity claim needs a baseline, an intervention, and a result. Without all three, it is usually just an anecdote with better formatting.
- Define the work unit you are measuring, such as a shipped feature, resolved support ticket, completed analysis, published campaign, or approved research memo.
- Record the baseline process before AI, including cycle time, human hours, error rate, review steps, and handoffs.
- Document the AI workflow, including tools used, model role, prompt strategy, retrieval sources, automation steps, and human review points.
- Measure the full completion time after AI, including prompting, editing, testing, review, integration, and rework.
- Compare output volume before and after AI using the same work unit, not a loose proxy such as drafts created or prompts submitted.
- Audit quality with a defined standard, such as defect count, acceptance rate, factual accuracy sampling, regression tests, or reviewer comments.
- Translate the result into business impact, such as hours saved, tickets resolved, conversion lift, cycle-time reduction, cost avoided, or risk reduced.
- Publish the proof package with artifacts, screenshots only where useful, a short decision log, and a clear statement of what AI did not do.
The final step matters. A credible AI portfolio does not pretend the model did everything. It separates machine assistance from human judgment. That is exactly what hiring managers need to evaluate.
A strong proof package might say: “I used AI to generate first-pass test cases and summarize API documentation. I rejected 14 generated tests because they asserted implementation details instead of user behavior. The final suite added 38 tests, caught two regressions before release, and reduced manual QA time by three hours per release.”
That is much better than “I used AI to speed up testing.” It gives the evaluator a work sample, a judgment sample, and a result.
Quality Gates: The Part Usage Dashboards Miss
AI productivity is incomplete without quality gates because faster output can raise downstream risk. The more AI contributes to production work, the more the workflow needs explicit standards for accuracy, security, maintainability, and accountability.
The failure mode is predictable. A team adopts AI. Draft volume goes up. Review queues grow. Senior people become cleanup staff. The dashboard shows adoption. The team feels slower, because it is.
Quality gates stop that drift. They turn AI output from “generated content” into inspected work.
The National Institute of Standards and Technology AI Risk Management Framework describes trustworthy AI systems through characteristics including validity, reliability, safety, security, resilience, accountability, transparency, explainability, privacy, and fairness. Those are broad ideas, but the practical translation is simple: someone has to define what acceptable output looks like before the model starts producing at scale.
For software builders, that might include automated tests, linting, dependency checks, code-owner review, and rollback plans. For analysts, it might include source traceability, calculation checks, assumption logs, and peer review. For content or marketing work, it might include factual verification, brand review, originality checks, and conversion measurement.
| Work type | Common AI risk | Quality gate | Evidence to show |
|---|---|---|---|
| Code | Passing-looking code with hidden edge-case failures | Unit tests, integration tests, code review, security scan | Test diff, bug count, review notes, deployment result |
| Data analysis | Wrong joins, weak assumptions, fabricated explanations | Source checks, formula review, sample validation | Data dictionary, audit sample, corrected assumptions |
| Customer support | Confident but wrong responses | Human review for high-risk categories, escalation rules | Accuracy audit, escalation rate, customer outcome |
| Research | Unsupported claims and weak synthesis | Citation check, source hierarchy, contradiction review | Source log, rejected sources, final memo |
The quality standard should be visible in the portfolio or performance review. A hiring manager does not need every private artifact. They need enough evidence to see that the builder understood where the model could fail.
This is also where judgment shows up. AI can generate ten options. The builder decides which one survives contact with reality.
Business Impact: Where AI Output Earns Its Claim
AI output earns a productivity claim only when it changes a business result or a work system. The result can be revenue, cost, cycle time, risk, quality, throughput, or decision speed, but it has to connect to a real constraint.
Not every project needs a revenue number. A lot of good builder projects improve internal throughput. A sales ops builder who cuts CRM cleanup from eight hours a week to one hour has created value even if nobody can tie a closed deal directly to that workflow. A product analyst who cuts experiment readout time from three days to same-day review changes decision speed in a way that matters.
The strongest impact claims use plain math. They do not overreach.
- Hours saved: “Reduced manual account research from 25 minutes to 8 minutes per account across 180 accounts per month.”
- Cycle time reduced: “Cut onboarding checklist completion from five business days to two by automating document classification and exception routing.”
- Quality improved: “Reduced duplicate ticket assignments from 11% to 3% in a 500-ticket monthly sample.”
- Revenue supported: “Increased qualified outbound list creation from 400 to 1,200 accounts per week, with qualification rules reviewed by sales leadership.”
- Risk reduced: “Flagged 37 missing contract fields before signature using a review workflow with human approval.”
This is where AI productivity measurement connects to hiring. A builder who can translate AI-assisted work into operating metrics is easier to trust than a candidate who only claims speed.
Companies making headcount decisions need the same discipline. Replacing a person with an AI workflow can look efficient right up until hidden review, exception handling, vendor management, and rework costs show up. That failure pattern is covered in AI Replacing Employees (2026): Hidden Costs and Rehiring Signals. For individual builders, the lesson is narrower: show the cost of the whole workflow, not just the impressive part.
AI Use vs AI Output in Hiring
Hiring teams should evaluate AI output, not AI use. The useful signal is whether a candidate can use AI to produce reliable work under constraints, explain tradeoffs, and show measurable results.
The old resume problem has a new version. “Experienced with AI tools” now means about as much as “experienced with the internet.” It is too broad to mean much.
A better interview asks for a work sample with constraints. Give the candidate a messy brief, incomplete data, competing goals, and a time box. Let them use AI. Then evaluate the final artifact and the decision trail.
The decision trail matters because AI makes polished answers cheap. A candidate can generate a slick strategy memo in minutes. The harder test is whether they can explain what they trusted, what they rejected, what they checked, and what they would do next if the work moved into production.
That is why “AI judgment” is becoming the hiring signal. The related Provn article on AI judgment at work covers examples and evaluation criteria in more detail. In this context, judgment means the candidate knows when to use AI, when not to, how to test the output, and how to connect it to a business result.
A simple hiring rubric can separate usage from productivity:
- Weak signal: Candidate lists tools used.
- Moderate signal: Candidate shows prompts and drafts.
- Strong signal: Candidate shows shipped work, measured improvement, review process, and decisions made without AI.
- Elite signal: Candidate shows repeatable workflow design that other people used successfully.
This is the NFL combine logic applied to AI work. The resume says someone played. The combine shows what they can do under measurement. Provn’s model is built around that distinction because the labor market is drowning in claims and short on proof.
Common Failure Patterns in AI Productivity Reporting
Most AI productivity reporting fails because it measures visible activity instead of completed work. Once you know what to look for, the bad patterns are pretty easy to spot.
The first pattern is the screenshot portfolio. It shows tool use, not work quality. A polished chat transcript does not prove that the output survived review, reached users, or improved a metric.
The second pattern is the first-draft fallacy. AI may cut draft time by 80%, but if review time triples, the workflow did not improve. This happens all the time in legal, finance, healthcare, security, and enterprise software, where mistakes are expensive.
The third pattern is metric substitution. A team wants productivity, but reports adoption instead. “Ninety percent of employees used the AI assistant this month” may help with rollout tracking. It says very little about whether the organization became more productive.
The fourth pattern is hidden human labor. AI handles the clean cases. Humans handle exceptions, angry customers, edge cases, approvals, and cleanup. If those tasks are not measured, the system looks better than it is.
The fifth pattern is false precision. A dashboard claims “$1.2 million saved” based on assumed hourly rates and theoretical time savings. Unless that saved time turned into fewer hours, more shipped work, faster cycle time, or measurable opportunity creation, the number is mostly a spreadsheet fantasy.
Good reporting stays closer to the ground. It says what changed, how it was measured, what was excluded, and what still requires human judgment.
A Practical AI Productivity Scorecard Template
An AI productivity scorecard should fit on one page and force the builder to connect AI usage to work shipped and value created. The format below works for portfolios, team reviews, and internal AI pilots.
The goal is not paperwork. The goal is to stop vague claims from sneaking through as evidence.
| Field | What to write | Example |
|---|---|---|
| Work unit | The measurable unit of output | Weekly churn-risk account review |
| Baseline | How the work happened before AI | 2 analysts, 6 hours weekly, spreadsheet review |
| AI role | Specific tasks handled by AI | Summarized call notes, flagged risk phrases, drafted account briefs |
| Human role | Judgment, review, escalation, approval | CS lead reviewed high-risk accounts and approved outreach plans |
| Output | What shipped or changed | 120 account briefs produced weekly |
| Quality check | How accuracy was tested | 20-account weekly audit; false positives tracked |
| Result | The measured improvement | Review time fell from 6 hours to 2.5 hours; escalation coverage doubled |
| Limitations | What the system cannot handle yet | Enterprise renewal accounts still require manual review |
This template also helps control costs. Once a team can see which model calls produce value and which ones create waste, it can tune prompts, context windows, retrieval, and review loops. The budgeting mechanics are covered separately in AI Token Costs (2026): Pricing Forecasts and Budget Controls.
For a builder, the scorecard turns a vague AI claim into hiring evidence. For a manager, it turns AI adoption into an operating review. For a company, it lowers the odds of paying for impressive-looking activity that never becomes output.
Frequently Asked Questions
What is the difference between AI productivity and AI usage?
AI usage measures activity, such as prompts, tokens, sessions, model calls, or tool logins. AI productivity measures completed work and outcomes, such as shipped features, reduced cycle time, fewer defects, lower review burden, hours saved, or measurable business impact.
Are tokens a good way to measure AI productivity?
Tokens are useful for cost tracking and workflow diagnosis, but they are a weak standalone productivity metric. Token volume should be paired with output measures such as completed tasks, quality audit results, rework time, and business value created.
How should builders prove AI productivity in a portfolio?
Builders should show the baseline workflow, the AI-assisted workflow, the shipped artifact, the quality checks, and the measured result. A strong portfolio separates what AI generated from what the builder reviewed, rejected, corrected, and shipped.
What metrics should companies use to evaluate AI productivity in 2026?
Companies should track usage, cycle time, shipped output, quality, and business impact together. A practical scorecard includes baseline human hours, AI workflow steps, review time, defect or error rate, delivered output, and the operating metric that changed after deployment.
Why do heavy AI users sometimes show low productivity?
Heavy AI users can be unproductive when they spend too much time prompting, retrying, generating drafts nobody uses, or correcting low-quality output. High usage becomes productive only when it produces reliable shipped work with less total effort or greater measurable value.